Every year, NRCA conducts a market survey to compile and examine important data from roofing contractors throughout the United States. The market survey allows contractors to compare their material usage with those in other regions, which can affect future business decisions. Whether contractors want to evaluate their businesses and current services or consider large capital investments, the survey allows them to see what similar businesses are doing. By analyzing the survey, contractors will be able to notice trends in the industry. For example, the survey can show which roof systems are being installed more frequently.
NRCA's market survey also provides manufacturers and distributors with data to analyze, such as roofing material, equipment and vehicle expenditures. These figures can be compared with those of previous years and future projections.
Although The National Roofing Contractors Association 2001-2002 Annual Market Survey shows a $3.66 billion decline (10.8 percent) in overall sales from 2000 to 2001, roofing contractors still seem to think 2001 was a pretty good year.
And the events of Sept. 11, 2001, and overall economic changes in the latter part of 2001 didn't decrease roofing contractors' optimism—they have hopes for a stable roofing industry and project an estimated growth of 4.1 percent for 2002.
Background
NRCA's market survey gives contractors an opportunity to provide feedback about the percentage of low- and steep-slope work performed, including warranted work, for new construction, reroofing and repair/maintenance during the year. The survey also addresses buying decisions and expenses, such as who decides which roof system type and manufacturer to use and the factors influencing those decisions, as well as the amount of expenditures for roofing materials, equipment, vehicles and labor.
To keep survey participants' names and data confidential, NRCA hired The Gary Siegel Organization Inc., Chicago, to compile the data. In November 2001, 1,039 surveys were mailed to NRCA contractor members and 1,053 surveys were sent to nonmember contractors in NRCA's database.
The Gary Siegel Organization received 219 responses yielding a 10.5 percent response rate, a rate lower than that of previous years' surveys. NRCA contractor member responses accounted for about three-fifths (63 percent) of the respondents.
When completing the survey questionnaire, respondents didn't always address every question posed, so the number of responses varies for each question. Also, some figures were rounded, so the results in each category may not total 100 percent.
Although it was not NRCA's intent to determine how representative the responses were statistically, you can assume a high degree of confidence in the results because of the response patterns and diversity of the survey respondents. But because of the diversity of the respondents and the fact that not all the same companies respond every year, the survey is not a definitive representation of the entire roofing industry.
For more specific analyses, the survey results are categorized by geographic region (see "The survey's scope"), as well as company sales volume, number of employees and years in the roofing business.
The market
The market survey provides contractors' opinions about current and expected roofing market conditions. Sales volume figures include sales of roofing, sheet-metal, waterproofing, insulation, repair/maintenance and roof deck work.
Total roofing industry sales reported by survey respondents for 2001 was $30.18 billion (down $3.66 billion from the previous year). Although projections for 2002 are less optimistic than projections made in 2000 for 2001, contractors expect a 4.1 percent increase in 2002, which would mean total sales of $31.42 billion.
Although contractors' average sales volumes were $1 million less in 2001 ($3.1 million) than in 2000 ($4.1 million), the figures seem to be on target when accounting for the industry's above-average figures in 2000, which had increased $1.4 million (52 percent) from 1999 compared with $400,000 (17 percent) from 1998 to 1999. Another influence on the industry's average sales volume is the percentage of respondents with large annual sales volumes. In 1999, 50 percent of respondents had annual sales volumes greater than $1.7 million as compared with 61 percent in 2000 and only 47 percent in 2001.
This does not mean roofing contractors averaged $1 million less in sales in 2001 than in 2000. Rather, the survey results show the previous year's survey respondents were larger contracting companies than those that responded in 2001. The 1999 results will provide a more consistent historical comparison when compared with 2001 results.
Low-slope numbers
According to the survey, the low-slope roofing market accounted for $19.01 billion (63 percent) of the total roofing market in 2001, which was a slight decrease from the 64.1 percent in 2000 (see Figure 1). (For survey purposes, "low-slope roofing" refers to roofs with slopes of 3-in-12 [14 degrees] or less.)
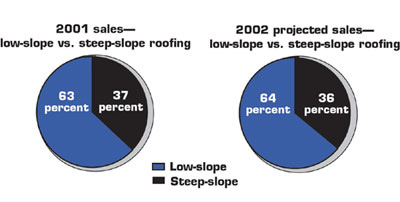
Figure 1: Low- and steep-slope roofing sales
Although the percentage of low-slope roofing has slightly decreased since 1999, contractors predict a 1 percent increase in market share and expect low-slope roofing to have 64 percent of the total roofing market in 2002 (see Figure 1). Reroofing work accounted for 61.9 percent ($11.76 billion) of the low-slope market in 2001. New construction accounted for 25 percent ($4.75 billion) of the market, and repair/maintenance work captured 13.2 percent ($2.5 billion) (see Figure 2).
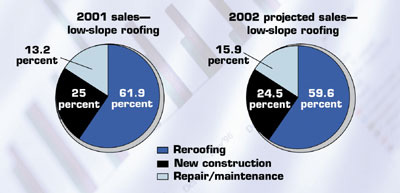
Figure 2: Reroofing, new construction and repair/maintenance sales for low-slope roofing
Of the low-slope reroofing work performed during 2001, tear-off and replacement was used 71.5 percent of the time with 28.5 percent being re-cover work (see Figure 3). This is consistent with 2000 figures, which showed 70.4 percent of low-slope roofing work to be tear-off and replacement and the remaining 27 percent to be re-cover work.
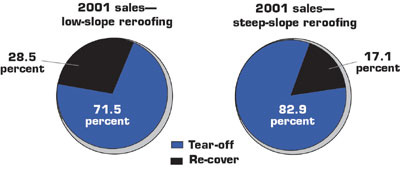
Figure 3: Reroofing methods used for low- and steep-slope roofing
As shown in Figure 4, contractors report single-ply roof systems accounted for 45.6 percent of new construction work in 2001 followed by modified bitumen at 20.7 percent and built-up roofing (BUR) coming in at 13.9 percent. These results vary substantially from those in 2000 where single plies captured 38.1 percent of the market; modified bitumen garnered 19.1 percent; and BUR took 22.4 percent.
| Percentages of 2001 low-slope roofing sales | ||
| Material type | New construction | Reroofing |
| BUR—asphalt | 12.3 | 15.6 |
| BUR—coal tar | 0.6 | 1.5 |
| BUR—cold process | 1 | 2.2 |
| EPDM | 27.9 | 24.2 |
| CSPE/Hypalon® | 1.7 | 1.2 |
| PVC | 7.5 | 6.9 |
| TPO | 7.1 | 4.5 |
| Other single plies | 1.4 | 2.6 |
| Spray polyurethane foam | 1.2 | 1.7 |
| Liquid-applied | 0.8 | 1.8 |
| Metal—structural | 2.1 | 1.6 |
| Metal—architectural | 5.2 | 3.5 |
| APP-modified bitumen | 10.1 | 10.4 |
| SBS-modified bitumen | 10.6 | 11.2 |
| Clay tile | 0.3 | 0.4 |
| Concrete tile | 0.9 | 0.2 |
| Fiberglass asphalt shingles | 6.7 | 7.9 |
| Organic asphalt shingles | 1.6 | 1.1 |
| Fiber-cement shingles | 0 | 0 |
| Wood shingles/shakes | 0.6 | 0.3 |
| Slate | 0.4 | 0.4 |
Figure 4: Average percentages of 2001 low-slope roofing sales by material type
The changes in material usage from 2000 to 2001 for new construction work also are reflected in reroofing work. The 2001 figures report single-ply roofing as capturing 39.4 percent of all reroofing work (up from 33.6 percent in 2000), followed by modified bitumen at 21.6 percent (down from 23.8 percent in 2000) and BUR at 19.3 percent (down from 27.8 percent in 2000). A three-year comparison of roofing sales categorized by roof system type is available in the 2001-02 market survey.
TPO use in low-slope new construction roofing projects steadily has been increasing during the past few years. In 2001, TPOs accounted for 7.1 percent of low-slope roofing work as compared with 5.5 percent in 2000 and 4.4 percent in 1999. Also in 2001, contractors reported applying PVC more frequently in new construction projects (7.5 percent) than in reroofing projects (6.9 percent).
The difference between the amount of new construction and reroofing work performed varies among regions. The East North Central region reports the largest margin of difference between the percentage of reroofing and new construction work performed (69.6 percent reroofing and 17.6 percent new construction). Repair/maintenance work in this region accounted for 12.8 percent in 2001.
The West South Central region exhibited the smallest margin of difference between reroofing and new construction—the region reported 55.9 percent reroofing work versus 35.1 percent new construction. The South Atlantic region had the highest percentage of low-slope repair/maintenance work—22.4 percent.
Steep-slope results
The steep-slope roofing market accounted for 37 percent of the market ($11.17 billion) in 2001 as compared with 35.6 percent in 2000. (For survey purposes, "steep-slope roofing" refers to roofs with slopes greater than 3-in-12 [14 degrees].) For 2002, contractors predict a slight drop in steep-slope roofing work and expect it to account for 36 percent of the total roofing market.
In the steep-slope roofing market for 2001, reroofing work captured 59.6 percent ($6.66 billion) followed by new construction at 29.4 percent ($3.28 billion) and repair/maintenance at 11 percent ($1.23 billion) (see Figure 5).
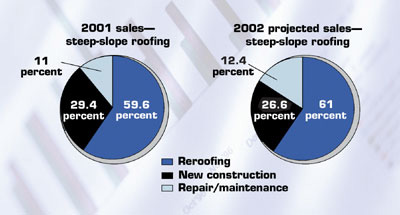
Figure 5: Reroofing, new construction and repair/maintenance sales for steep-slope roofing
Of the steep-slope reroofing work completed during 2001, 82.9 percent involved tear-off and replacement and 17.1 percent involved re-cover work (see Figure 3). For 2002, contractors expect reroofing work to account for 61 percent of steep-slope roofing work followed by new construction at 26.6 percent and repair/maintenance at 12.4 percent (see Figure 5).
As in previous years, fiberglass asphalt shingles were used most often for steep-slope roofing work during 2001 (see Figure 6). Fiberglass asphalt shingles had an increased market share in 2001 and accounted for 44.9 percent of steep-slope new construction work as compared with 39.8 percent in 2000. The percentage of fiberglass asphalt shingles applied in reroofing work remained constant at 50.4 percent for 2001.
| Percentages of 2001 steep-slope roofing sales | ||
| Material type | New construction | Reroofing |
| BUR—asphalt | 1.1 | 1.8 |
| BUR—coal tar | 0 | 0 |
| BUR—cold process | 0.1 | 0.9 |
| EPDM | 4.5 | 5.3 |
| CSPE/Hypalon® | 0.4 | 0.3 |
| PVC | 0.4 | 0.9 |
| TPO | 1.2 | 0.4 |
| Other single plies | 0 | 0.6 |
| Spray polyurethane foam | 1.1 | 1.1 |
| Liquid-applied | 0.1 | 0.9 |
| Metal—structural | 3.7 | 4.2 |
| Metal—architectural | 20 | 14.1 |
| APP-modified bitumen | 1.4 | 1.4 |
| SBS-modified bitumen | 1.2 | 1 |
| Clay tile | 3.4 | 2 |
| Concrete tile | 3.3 | 2.9 |
| Fiberglass asphalt shingles | 44.9 | 50.4 |
| Organic asphalt shingles | 4.8 | 5.1 |
| Fiber-cement shingles | 0.1 | 0.2 |
| Wood shingles/shakes | 2.9 | 2.8 |
| Slate | 3.8 | 3 |
Figure 6: Average percentages of 2001 steep-slope roofing sales by material type
Architectural metal had an increase of 2.9 percent in 2001 and accounted for 20 percent of new construction work. Reroofing work using architectural metal increased 4.5 percent in 2001 bringing usage to 14.1 percent. Organic asphalt shingles came in at 4.8 percent for new construction work and 5.1 percent for reroofing work.
Respondents in the East South Central region report the largest margin of difference between steep-slope reroofing work and new construction (75.8 percent reroofing versus 16.7 percent new construction). Repair/maintenance accounted for 7.5 percent. The Mountain region reported the smallest margin of difference between reroofing work and new construction, which were 44.9 percent and 37.3 percent, respectively. The highest percentage of steep-slope repair/maintenance work (17.8 percent) was reported by the Mountain and Pacific regions.
Insulation
The market survey also asks contractors to specify the type of insulation most often used in low-slope roof system installations. (Because results were skewed for previous years, the survey no longer includes a question related to steep-slope insulation usage.) Polyisocyanurate insulation consistently has been the most popular choice and accounted for 55.9 percent of the low-slope market (see Figure 7) in 2001. Wood fiberboard is second with 13.1 percent of the market share followed by perlite with 11.8 percent.
| Percentages of low-slope insulation installations | ||
| Insulation type | 2001 | Projected 2002 |
| Expanded polystyrene (EPS) | 9.7 | 10.2 |
| Extruded polystyrene (XPS) | 1.4 | 1.6 |
| Fiberglass | 2.1 | 2.5 |
| Cellular fiber | 1.4 | 0.7 |
| Mineral fiber | 0.7 | 0.7 |
| Perlite | 11.8 | 12 |
| Polyisocyanurate | 55.9 | 54.9 |
| Composite | 2.2 | 2.4 |
| Wood fiberboard | 13.1 | 13.2 |
| Other | 1.7 | 1.9 |
Figure 7: Average percentage of 2001 low-slope insulation installations by insulation type
Projections for 2002 low-slope insulation installations are consistent with 2001 figures; polyisocyanurate insulation is expected to be used 54.9 percent of the time, and wood fiberboard and perlite insulation are expected to be used 13.2 percent and 12 percent of the time, respectively (see Figure 7).
Business decisions
Consistent with previous years' results for new construction projects, architects and specifiers typically decide which roof system will be installed. And it usually is up to a roofing contractor's discretion as to the manufacturer. For reroofing projects, both decisions (selecting a roof system and manufacturer) primarily are made solely by roofing contractors.
When asked what criteria most commonly were used in selecting roofing materials, roofing contractors ranked the following from most important to least important: track record, service from the manufacturer, ease of installation, availability, price and warranty. When comparing the results from the 2000-01 survey, contractors now believe availability is more important than price.
Using the Survey
NRCA's market survey provides invaluable information about the U.S. roofing industry. Many interesting trends can be observed when you compare current results with those of previous years.
Obviously, a higher response rate will yield more meaningful and accurate results. If you are asked to participate in NRCA's 2002-03 market survey, please do so. The accuracy of the information NRCA obtains about the roofing industry will help you make better decisions for your business.
Olicia Hinojosa is NRCA's manager of international relations and work force programs, and Karen Kane is NRCA's director of contractor management programs.
The survey's scope
Roofing contractors in the following 11 regions were surveyed for NRCA's 2001-02 market survey:
New England—Connecticut, Maine, Massachusetts, New Hampshire, Rhode Island and Vermont
Mid-Atlantic—New Jersey, New York and Pennsylvania
South Atlantic—Delaware; Florida; Georgia; Maryland; North Carolina; South Carolina; Virginia; Washington, D.C.; and West Virginia
East North Central—Illinois, Indiana, Michigan, Ohio and Wisconsin
East South Central—Alabama, Kentucky, Mississippi and Tennessee
West North Central—Iowa, Kansas, Minnesota, Missouri, Nebraska, North Dakota and South Dakota
West South Central—Arkansas, Louisiana, Oklahoma and Texas
Mountain—Arizona, Colorado, Idaho, Montana, Nevada, New Mexico, Utah and Wyoming
Pacific—California, Oregon and Washington
Alaska and Hawaii
Puerto Rico and U.S. Virgin Islands


COMMENTS
Be the first to comment. Please log in to leave a comment.