
The 2010 edition of ASCE 7, "Minimum Design Loads for Buildings and Other Structures," became available in May and replaces the 2005 standard. ASCE 7, issued by the American Society of Civil Engineers (ASCE), provides information that allows designers to determine various types of loads and load combinations on buildings.
The wind load provisions in the new edition have changed dramatically from those in the 2005 publication. In some instances, loads on a given building are higher, and in other cases, they are lower. The 2010 changes are the most significant since the dramatic changes of the 1995 edition. The 2010 edition will be referenced in the 2012 editions of the International Building Code and International Residential Code.
Following is an overview of the additions and changes pertaining to calculating wind loads on roof assemblies only. I do not address changes that only pertain to primary structural elements such as beams, columns, shear walls and diaphragms that provide support and stability for overall buildings.
The maps
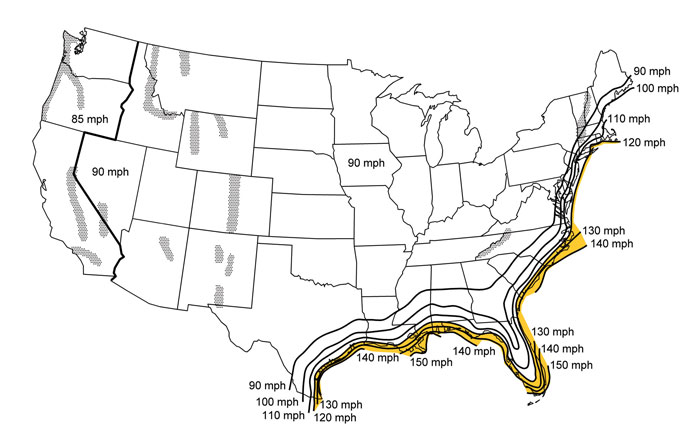
Figure 1: ASCE 7's 2005 edition provides basic design wind speeds in one map.
In the 2005 edition, basic (design) wind speeds are presented in one map (see Figure 1). In the continental U.S., basic wind speeds range from 85 to 150 mph. These speeds are for peak gusts measured at 33 feet above grade in Exposure C (open terrain).
In the 2010 edition, there are three maps. One map is for buildings in Category I (buildings representing a low risk to life in the event of failure, such as a greenhouse). The second map is for buildings in Category II, which include most residential, commercial and industrial buildings. The third map is for buildings in Categories III and IV, which include buildings housing a large number of people and buildings providing critical community services (such as schools, hospitals, and fire and police stations).
The 2010 maps are "strength design" maps, meaning they map winds that have a much longer mean recurrence interval than the 2005 mapped speeds. As can be seen in Figure 2, the speeds for Category II buildings range from 110 to 180 mph (as with the 2005 edition, these are also for peak gusts at 33 feet above grade in Exposure C). For Category II buildings, the 85 mph from 2005 is equivalent to the 110 mph from 2010.
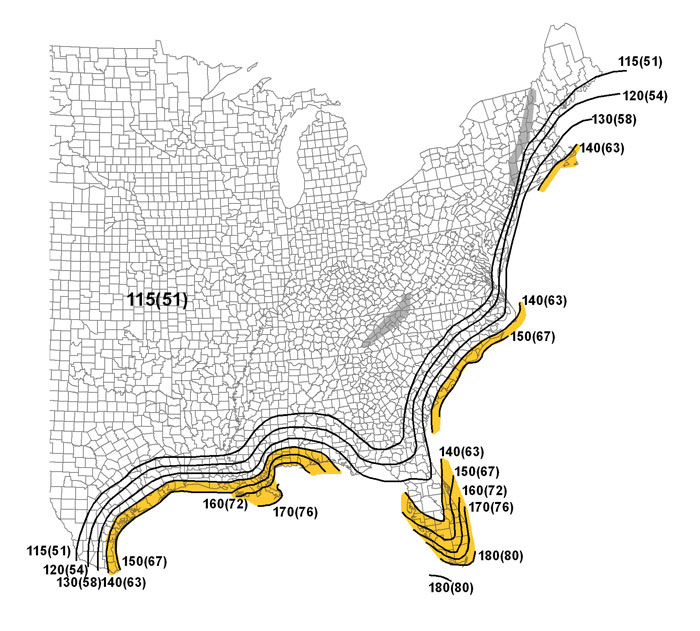
Figure 2: Category II wind speeds in ASCE 7's 2010 edition
In the 2005 edition, an importance factor was used in the wind load calculation equation to account for the building categories. The importance factor reduced loads for Category I and increased them for Categories III and IV. Because the 2010 edition provides separate maps for the various building categories, the importance factor was eliminated. The influence of building category can be seen by comparing Category II wind speeds of 110 to 180 mph (see Figure 2) to the Categories III and IV wind speeds of 115 to 200 mph (see Figure 3).
To compensate for the change to strength design maps, changes were made to the load combination criteria provided in Chapter 2. In the 2005 edition, a load factor of 1.6 was used for strength design. This was changed to 1.0 in the 2010 edition. Except in the hurricane-prone region along the Atlantic Ocean and Gulf of Mexico, wind pressures calculated in accordance with ASCE 7's 2005 edition should be about the same as those calculated in accordance with its 2010 edition. When using allowable stress design (which almost always is the case for roof systems), a load reduction factor is used as delineated in Chapter 2.
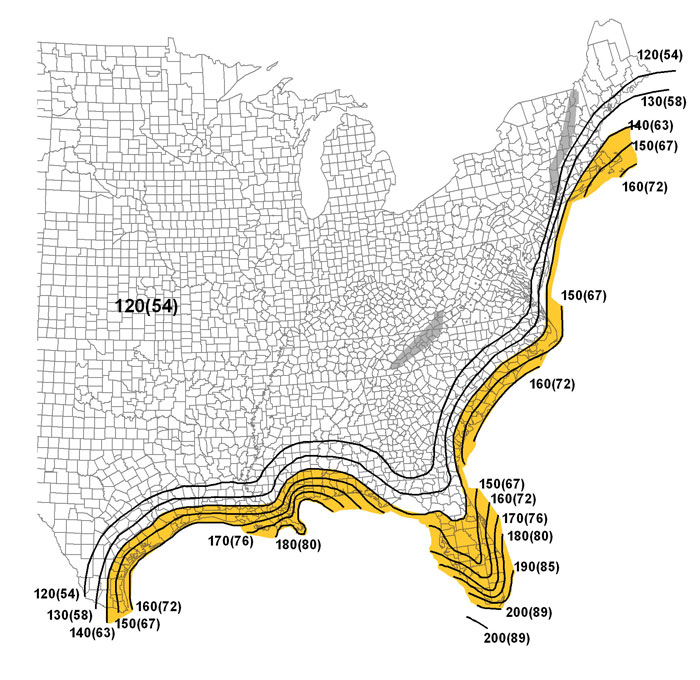
Figure 3: Categories III and IV wind speeds in ASCE 7's 2010 edition
The other significant mapping change occurs in the same hurricane-prone region. By comparing Figure 1 with Figures 2 and 3, you will notice the location of the contour lines has changed. The boundaries between hurricane-prone and nonhurricane-prone regions generally have shifted toward the coast. As can be seen, in some areas, the shift is quite significant. The location of the contours that occur between the boundary line and coast also has shifted.
As a result, some areas that previously were in a hurricane-prone region no longer are in one. Also, the contour shifts will result in reduced design wind loads on many buildings.
All the Atlantic/Gulf of Mexico contour lines are driven by hurricane winds. The 2010 change in contour location is based on new, more complete analysis of hurricane characteristics.
Determining resistance
ASCE 7 addresses wind loads, not resistance. However, it is important to consider how the changes to strength design maps affect resistance determination. When using the 2005 edition, wind-uplift loads are calculated for the different roof zones (field, perimeter and corner). For low-slope roof assemblies, the field-uplift design pressure commonly is calculated and then multiplied by a safety factor of 2 to obtain the minimal level of resistance a system would need to have achieved during laboratory testing.
For example, consider a mechanically attached membrane system on a 30-foot-tall Category II building in a suburban exposure (Exposure B) in the center of the U.S. (90-mph wind zone). Using the simplified procedure (in Figure 6-3 of the 2005 edition), the design uplift load is 14.6 pounds per square foot (psf) in the roof's field: 14.6 psf x 2 (safety factor) = 29.2 psf. So for the roof's field, a system would be needed that resisted a test pressure of at least 29.2 psf. Therefore, a system that had a rating of FM 1-60 would be sufficient because such a system would have successfully resisted 60 psf during testing.
Now, consider the same building, but analyze it using ASCE 7's 2010 edition. The basic wind speed becomes 115 mph. Using the simplified procedure, the strength design uplift load is 23.8 psf in the field of the roof. Using the load reduction factor of 0.6 from Chapter 2 for allowable stress design (ASD), 23.8 psf x 0.6 = 14.28 psf, which becomes the ASD load. So 14.28 psf x 2 (safety factor) = 28.56 (slightly lower than the 29.2 psf derived from the 2005 edition). As with the 2005 procedure, a system that had an FM 1-60 rating still would be sufficient.
When working with roof systems via ASD with the 2010 edition, it is important to apply the 0.6 load reduction factor and apply the safety factor (typically 2) to specify an appropriate laboratory uplift-resistance rating.
Hurricane coast
Before the 1998 edition of ASCE 7, a narrow strip of land along an ocean's coast was included in Exposure D conditions. However, research during the 1990s indicated that during hurricanes, oceans were rough and more approximated Exposure C conditions. So the 1998 edition specified that land along hurricane coastlines be designated as Exposure C, which substantially reduced the wind load.
Subsequent research has shown surface roughness over oceans during hurricanes is consistent with Exposure D. As a result, ASCE 7's 2010 edition requires use of Exposure D along hurricane coastlines (see the photo). Therefore, buildings near a coast (as defined by ASCE 7) typically will have significantly higher wind loads under the 2010 edition versus the 2005 edition.
Determining a building's exposure sometimes is difficult. Further guidance for exposure assessment and interpolating between exposure categories is provided in the standard's commentary. The commentary is not part of the standard, but it is bound with it and consists of explanatory and supplementary material designed to assist in applying the standard's requirements.
Wind-borne debris region
A wind-borne debris region was added to the 1995 edition. The wind-borne debris region occurs within a portion of the hurricane-prone region. The 2005 edition requires that glazing in buildings in Categories II, III and IV be impact-resistant or protected with an impact-resistant covering (an exception is stipulated for certain buildings taller than 60 feet).
In the 2005 edition, the extent of the wind-borne debris region is the same for Categories II, III and IV. However, this no longer is the case. In 2010, the wind-borne debris region occurs within 1 mile of the coast where the basic wind speed is equal to or greater than 130 mph or where the basic wind speed is equal to or greater than 140 mph. Because Categories III and IV's contours for 130- and 140-mph winds extend much further inland than Category II's contours, the wind-borne debris region is much larger for some Category III buildings and all Category IV buildings compared with Category II buildings.
The figures' shaded areas show the wind-borne debris regions. The 2010 wind-borne debris region for Category II buildings is fairly consistent with the 2005 criteria, but in 2010, there is a significant reduction in how far inland the region extends from the coast around Jacksonville, Fla., the Florida panhandle and North Carolina.
During hurricanes, a majority of the wind-borne debris-induced glazing damage occurs within the wind-borne debris region shown in Figure 2. However, damage investigations have shown sporadic damage inland of the region. Because of the critical nature of services provided by buildings in Category IV and some in Category III, ASCE 7's 2010 edition incorporates more conservative criteria for such buildings.
Simplified procedure
The simplified procedure, which provides tabulated pressure values, was limited to buildings up to 60 feet high in ASCE 7's 2005 edition. Tables now are provided for buildings up to 160 feet high. Users of the simplified procedure should have a good understanding of ASCE 7. Although it is easy to determine design pressures from the tables, it also is easy to incorrectly determine a value if there is lack of understanding.
Rooftop equipment
Further research has been conducted regarding loads on rooftop equipment, which has resulted in refinements in the 2010 edition. See Sections 29.51, 30.11 and C29.6 for more information.
Risk category
Criteria regarding building categories are provided in Chapter 1 in the 2005 and 2010 editions. In 2005, the categories were referred to as "Occupancy Categories." For each of the four categories, specific occupancies were defined (for example, a building where more than 300 people congregate in one area). In 2010, the categories are referred to as "Risk Categories," but more important, specific occupancies are not listed. For example, Risk Category III says: "Buildings and other structures, the failure of which could pose a substantial risk to human life."
The lack of specificity in building category selection (which has a large effect on calculated loads) may present liability exposure to designers. I encourage designers to carefully review ASCE 7's Section C1.5.1 and discuss it with building owners so appropriate risk categories are selected. Although building codes stipulate building categories, with the 2010 change in Chapter 1, in some instances it may be prudent and appropriate to select a higher category than what the building code requires.
Chapter reorganization
In ASCE 7's 2005 edition, wind load provisions were provided in Chapter 6. The 2010 edition provides wind load provisions in six chapters. Chapter 26 has general requirements, Chapters 27-29 address main wind-force resisting systems, Chapter 30 addresses components and cladding (which include roof systems), and Chapter 31 addresses wind tunnel procedures. It will take awhile to become familiar with the new organization, but the new organization should facilitate the standard's use.
End result
Determining design wind loads is a key factor in ensuring good high-wind performance of roof assemblies. Unless wind loads are appropriately determined and designed for, blow-off problems can be expected.
ASCE 7's wind load provisions are relatively easy to use for those familiar with the standard; however, it is just as easy for a novice to make serious errors. First-time users of the standard should become familiar with it before determining wind loads.
To purchase ASCE 7's 2010 edition, go to www.asce.org/product.aspx?id=2147487569.
Thomas L. Smith, AIA, RRC, is president of TLSmith Consulting Inc., Rockton, Ill., and a member of the ASCE 7 Task Committee on Wind Loads.