Editor's note: The following article originally was presented as a paper during the RCI 30th International Convention and Trade Show March 5-10 and is republished here with permission.
As a result of environmental concerns and regulations regarding solvent-based single-ply adhesives, the use of water-based and low-volatile organic compound (LVOC) solvent-based adhesives is becoming much more popular in the low-slope roofing market.
At the same time, roofing industry professionals have become concerned with longer drying times exhibited by water-based and LVOC products because both react differently than solvent-based adhesives as temperatures and humidity levels change on the roof.
Research conducted by Johns Manville, Denver, has found when temperatures and dew points converge, drying times of water-based adhesives significantly are extended. When this happens, performance issues in the field tend to increase.
A case study
Although there is general industry consensus that performance issues are related to water-based adhesive drying rates, similar problems also may apply to LVOC adhesive products.
From an installation standpoint, these concerns have taken the form of blistering and/or inadequate adhesion of single-ply membranes to substrates when using water-based and LVOC adhesives in certain environmental conditions.
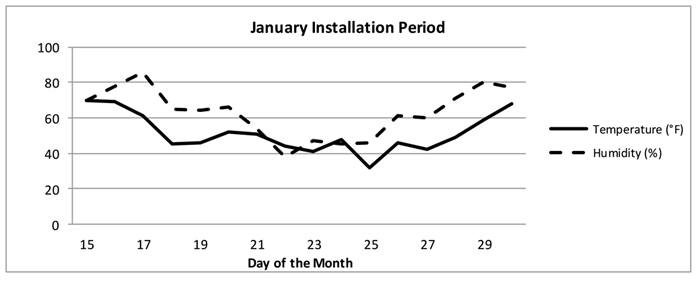
Source: Weather Underground
Figure 1: Average temperatures and humidity for case study
These performance issues were evident during a case study conducted by Johns Manville on a fleece-backed TPO roof system in the southeastern U.S. Installation of the roof system occurred between January 2013 and March 2013 using a water-based adhesive. During the application period for the adhesive, daytime temperatures were above 40 F. The specific application period of concern was from mid-January to the end of January. Figure 1 illustrates the average temperatures and humidity during the installation time period.
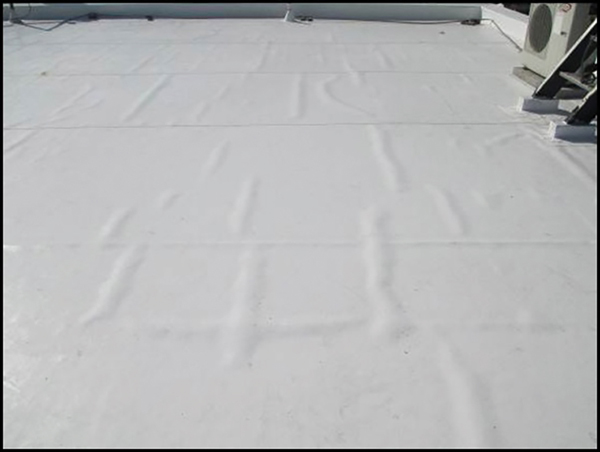
Figure 2: Adhesion loss occurred within several days of case study adhesive installation.
Several days after adhesive application, field engineers reviewed loose membrane concerns (see Figure 2). After visual inspection of the membrane, roof cuts were taken in several places. The adhesive still was tacky, but there was no adhesion to the substrate. Further evaluation of the system showed moisture was present (see Figure 3).
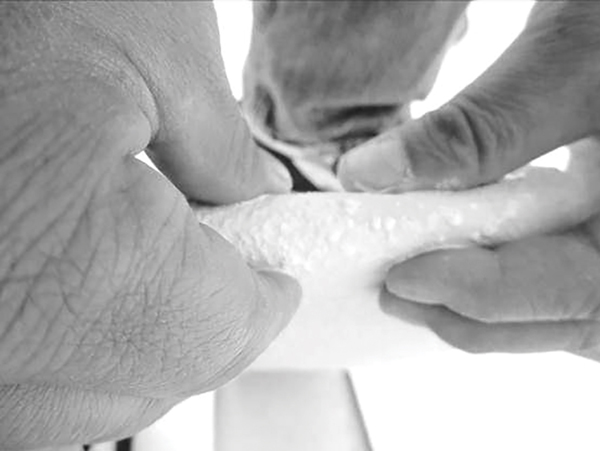
Figure 3: Roof cuts show moisture beads present in the fleece-backed material.
Dew point also was taken into consideration. During installation, the temperature difference between ambient temperatures and the dew point was 6 F to 9 F, slightly higher than the 5 F rule of thumb. Figure 4 identifies a critical installation period.
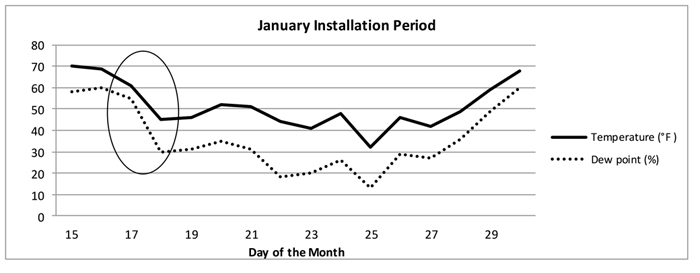
Figure 4: The circled area indicates the critical application period when installation and roof system performance were affected.
One of the key findings of the case study is in lower temperatures and higher dew point conditions, the drying times of water-based adhesives may be extended from 1 to 1 1/2 hours or more. In addition, ambient rooftop conditions may change during application and further extend adhesive dry-out periods. For this reason, roofing contractors, roof consultants and specifiers should be aware of these prolonged drying times and take precautionary measures in the field to ensure proper adhesion of single-ply membranes to substrates.
Under certain environmental conditions, such as temperature, dew point and relative humidity, installation times of adhered single-ply roof systems may need to be increased significantly, affecting production and project schedules.
Laboratory testing
One of the objectives of the single-ply roofing adhesive case study was to determine the effects of environmental conditions (temperature, dew point and relative humidity) on flash time and percent of adhesion after one hour. To further the research, laboratory testing also was conducted.
Four water-based and three LVOC adhesives were purchased from local distributors. The substrate for each test sample consisted of 2-inch-thick polyisocyanurate insulation per ASTM C1289, "Standard Specification for Faced Rigid Cellular Polyisocyanurate Thermal Insulation Board," Type II, Class 1, Grade 2, 20 psi with fiberglass-reinforced paper facer. Laboratory testing in an environmental chamber included a variety of adhesive coverage rates.
All commercially available adhesives were applied as specified by following product labeling and data sheets. The instructions followed a standard industry application of two-sided contact adhesive with polyisocyanurate insulation.
The first laboratory test was conducted using water-based adhesive samples conditioned at 60 F and 45 percent relative humidity. Typical coverage rates were between 100 to 120 square feet per gallon, which represents average field coverage rates for water-based adhesives. The differences in coverage rates were used to determine whether they were related to observed differences. Performance was defined by flash time and percent of adhesion after one hour.
Researchers classified an adhesive as dry and then rolled the membrane into the adhesive and let the sample sit in the conditioned environment. The single-ply membranes then were peeled back to determine the level of adhesion for each sample. Obviously, if the samples were allowed to sit for a longer time period, greater adhesion values resulted.
Actual drying time was indicated by the traditional "touch" test to ensure there was no stringing of adhesive coming off the substrate. Estimated dry time was incorporated into a regression analysis (a statistical process for estimating the relationships among variables) based on coverage rate, temperature and relative humidity to give an estimated dry time.
The equation generated in this work followed fairly consistently with observed drying times. Throughout the testing, "bad" performance was defined as limited polyisocyanurate facer delamination, and "good" performance was indicative of strong facer delamination.
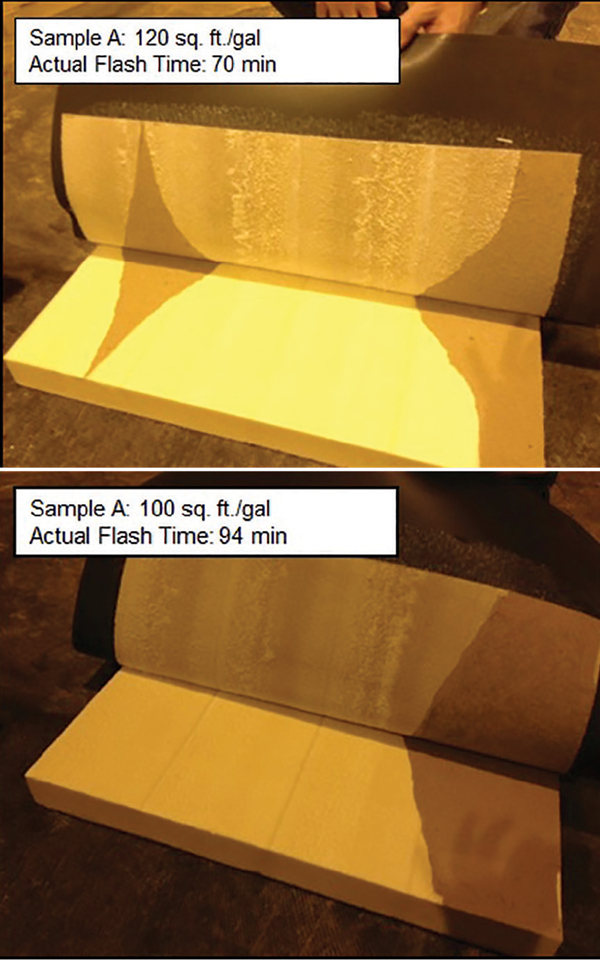
Figure 5: Samples tested with good adhesion
As seen in Figure 5, using a coverage rate of 120 square feet per gallon was quickest to dry at 70 minutes, and Sample A was slowest to set at 94 minutes, which is consistent with a thicker coverage rate of 100 square feet per gallon. This test was conducted at 60 F and 45 percent relative humidity with a difference of 22 degrees between the temperature and dew point.
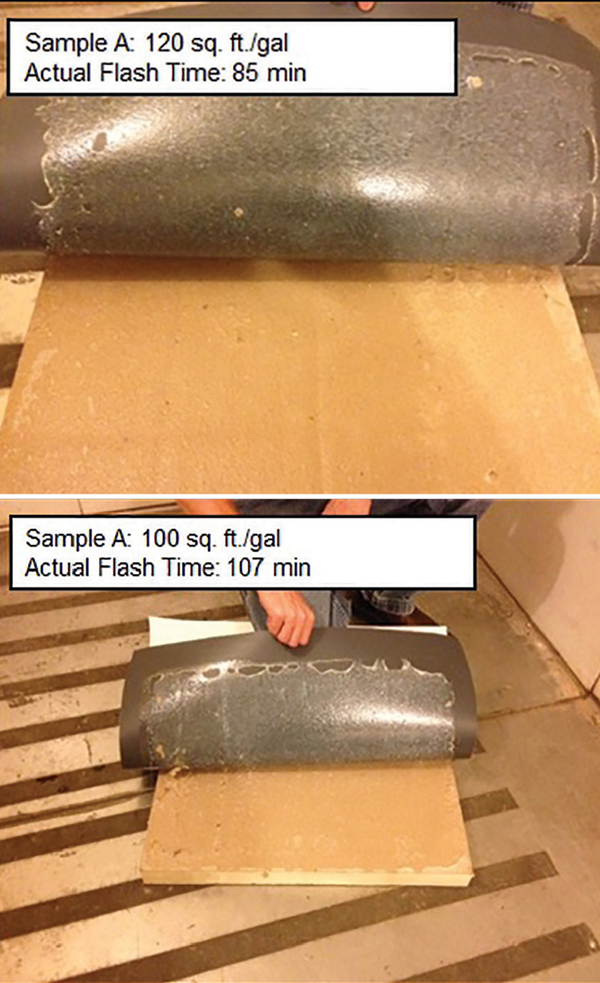
Figure 6: Samples tested with poor adhesion
The same test (see Figure 6) then was performed at 75 F and 75 percent relative humidity with an 8-degree difference between the dew point and surface temperature. In these test conditions, the adhesion between the substrate and the membrane was poor and the actual adhesive flash time increased 13 percent and 20 percent, respectively.
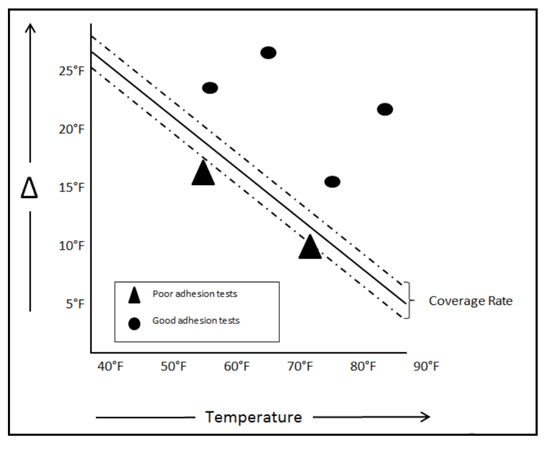
Figure 7: The test results show air temperature versus the difference between surface temperature and dew point. The triangles indicate poor adhesion, and the black dots indicate successful adhesion.
Figure 7 charts temperature versus the difference between dew points and surface temperatures. The Y axis represents the temperature difference between dew points and surface temperatures, and the X axis represents temperature. The dots and triangles indicate the testing performed at various temperatures and humidity settings. The triangles indicate test conditions that produced poor adhesion results, and the black dots indicate tests that demonstrated successful adhesion results.
It was observed that as temperatures increased (80 F), the sensitivity to the difference between the temperature and dew point was not as strong. However, as shown in the chart, when temperatures decrease, there needs to be a bigger difference between the actual temperature and the dew point for good adhesion. At 60 F, instead of a temperature/dew point difference of 5 degrees, a more appropriate value may be 10 or 15 degrees.
Source: www.engineeringtoolbox.com/us-outdoor-design-temperature-humidity-d_296.html
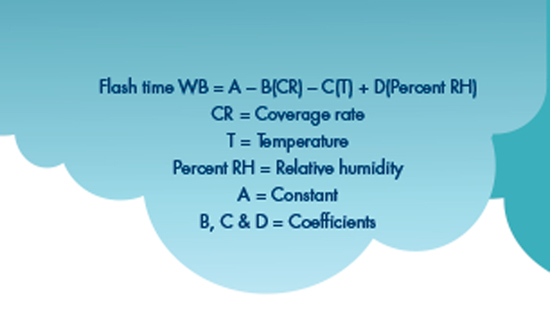
Figure 8: An example of what a formula may look like to estimate flash time as a function of coverage rate, temperature and relative humidity
Figure 8 shows a regression-analysis equation for water-based adhesives with the formulation's average accuracy among the four tested samples at about 10 percent. It is important to remember all the samples were tested in a static laboratory environment. The effects of wind and sun (ultraviolet radiation) undoubtedly would accelerate drying time in real-world conditions, so the drying times in these tests probably are worst-case scenarios. It also is better to over-dry contact adhesives than to put them together wet.
Source: www.engineeringtoolbox.com/us-outdoor-design-temperature-humidity-d_296.html
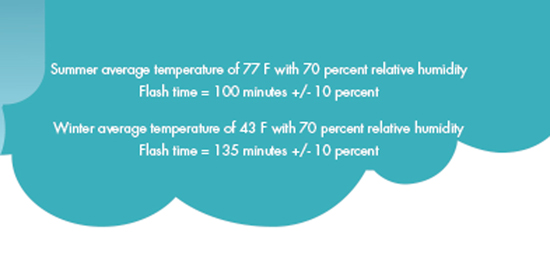
Figure 9: An example of how the equation in Figure 8 can be used to predict drying times during summer and winter conditions in Atlanta
Figure 9 shows an example of how the equation in Figure 8 can be used to predict drying times for summer and winter conditions in Atlanta. According to the calculations, drying conditions between summer and winter can vary as much as 35 minutes. This understanding, coupled with shorter workdays during winter months, clearly demonstrates the concerns regarding applying adhesives in conditions that are less than ideal. A similar application tool has been developed by Johns Manville using this information and is available for use.
Additional laboratory tests were conducted using LVOC adhesive samples. One of the tests was conditioned at 60 F and 70 percent relative humidity at a dew point of 50 F or 10 F difference. The second set of samples was conditioned at 60 F and 83 percent relative humidity at a dew point of 55 F or 5 F difference. Coverage rates were between 55 to 70 square feet per gallon.
The tests demonstrate LVOC adhesives do not appear to have the same sensitivity to temperature/dew point differentials as water-based adhesives. The main observation regarding the tested samples was the need to ensure the adhesive was fully dry upon installation.
Following the tests, several LVOC samples were installed wet at 75 F and 75 percent relative humidity and 60 F and 45 percent relative humidity. The samples were peeled back after one hour of drying and again after an additional 48 hours of drying. The most noticeable issue for samples installed wet was the adhesive surface appeared skinned over after one hour of drying time. The samples failed the touch test, and the membrane moved (slid) when pressure was applied. All samples exhibited little to no adhesion to the substrate.
Differences in adhesives
Not surprisingly, the drying times for water-based and LVOC adhesives differed. LVOC sampling surprisingly was consistent for the lower temperatures (50 F to 60 F) with drying ranges from 31 minutes to 51 minutes depending on adhesive type. Testing will need to be performed at additional temperatures to help develop predictive modeling necessary for all conditions.
The main take-away is the ability to get a more uniform coverage rate influenced by appropriate temperatures and dew points. An additional variable observed during the experiment was the sensitivity of drying behavior as a result of puddling of adhesives. Thicker adhesive areas tend to increase drying times and often are the reasons for blisters on enclosed membranes.
Conclusions
The regression analysis (Figure 8), as a function of temperature, relative humidity and coverage rate, was relatively successful for predicting accurate flash times of water-based adhesives. However, additional testing methods will need to be evaluated to optimally characterize LVOC adhesive material performance.
From a field installation perspective, roofing professionals need to show greater concern on applications where temperatures and dew points converge. When these values are close to intersecting, poor membrane adhesion to the substrate likely will occur when using water-based adhesives. Poor adhesion will, in turn, often lead to more field-performance issues.
During periods of warmer weather (80 F) and higher relative humidity, the risks of adhesion problems are reduced. However, the opposite is true as temperatures drop and the separation between surface temperature and dew point temperature increases.
Although the rule of thumb always has been a 5-degree difference between temperature and dew point, this differential may need to be adjusted as high as 15 degrees when temperatures begin to drop below 60 F.
Although coverage rate, temperature and relative humidity showed promise for predicting flash times, in a controlled environment, further work is needed to understand the effects of other environmental conditions such as cloud cover, sun and ambient rooftop temperatures.
For all these reasons, we recommend architects build more flexibility into their adhesive specifications and consider the ramifications of construction schedules and the unpredictability of environmental conditions.
Many people complain about the weather, but no one can change it or predict exact environmental conditions during every hour of a roofing project. It is better to build in a margin for error than wind up with adhesives that don't stick.
Zebonie Sukle is single ply engineering lead for Johns Manville, Denver, and Todd Nathan is senior manager, technical services for Johns Manville.