
The recently completed 2004 NRCA Management Performance and Financial Survey provides a comprehensive set of benchmarks about roofing contractors' financial performances. First conducted in 1979, the survey has been a beneficial tool for roofing contractors across the U.S. Every NRCA contractor member was given the opportunity to participate in the 2004 survey, and the results reported in this article and the actual survey results are based on a response rate of 7 percent. (Note the response rate is not statistically relevant.)
To better help you compare your financial information with other contractors across the U.S., the results of the biennial survey are divided into five sales volume categories (less than $1.5 million; $1.5 million-$3 million; $3 million-$6 million; $6 million-$10 million; and more than $10 million), as well as nine geographic regions (see "The survey's nine regions," page 36).
Findings worth noting
The region that experienced the largest growth in net sales was the Southwest with a 17.3 percent reported increase from 2003 to 2004, closely followed by the Mid-Atlantic with a reported increase of 16.1 percent. Falling in last place, the Northeast was the only region that reported a decrease; net sales fell 8 percent from 2003 to 2004 (see Figure 1).
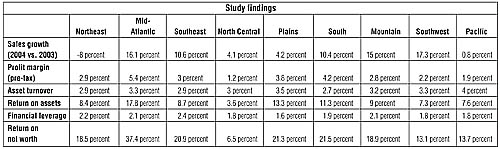
Figure 1: Findings from NRCA's 2004 Management Performance and Financial Survey
According to what commonly is called the Strategic Profit Model, roofing contracting firms in the Mid-Atlantic seem to be doing something right. This region reported the highest pre-tax profit margin at 5.4 percent, highest pre-tax return on assets at 17.8 percent and highest pre-tax return on net worth at 37.4 percent. And as mentioned earlier, the region reported the second-highest sales growth from 2003 to 2004.
The Strategic Profit Model is a comprehensive return on investment analysis that takes into account two return on investment measures (return on assets and return on net worth) and three performance ratios (profit margin, asset turnover and financial leverage). The profit model in Figure 2 uses figures for the Mid-Atlantic region.
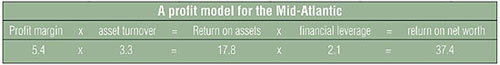
Figure 2: An example of the Strategic Profit Model
Survey results also were broken into low-slope (slopes of 3-in-12 [14 percent] or less) and steep-slope (slopes greater than 3-in-12 [14 percent]) roofing work. Of all survey respondents, 76 percent reported a majority of their business involved low-slope projects. These firms reported median sales of $4,693,557 as compared with the 24 percent of firms that reported having a steep-slope focus with reported median sales of $3,280,760 (see Figure 3).
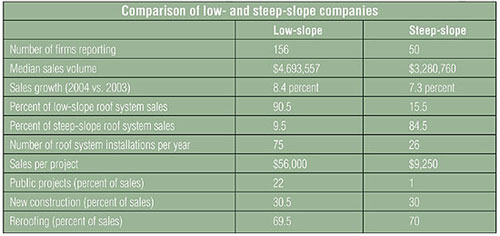
Figure 3: Comparison between low- and steep-slope contracting firms
Getting high profits
The 2004 NRCA Management Performance and Financial Survey results suggest there are some major differences between typical firms and high-profit firms. The differences are significant for planning and control purposes.
A typical firm surveyed is in the middle, or median, of all firms in terms of its financial results. That is, half the companies will perform better than the typical one and half will perform worse. To a certain extent, typical can be thought of as "good enough." After all, the firm is performing as well as half the firms. But in reality, "typical" is not good enough.
According to survey results, the typical responding roofing firm generates sales of $4,534,114. On that sales base, it produces a pre-tax profit of $108,819. This means the firm produces a profit margin of 2.4 percent of sales. Stated somewhat differently, each $1 of sales results in 2.4 cents of profit. This means with the same sales base, the high-profit organization would produce $367,263 in profit. This would give the high-profit firm an annual profit advantage of $258,444, or an additional 5 percent to 7 percent. A responding high-profit company generates a profit margin of 8.1 percent. To determine the group of high-profit firms, all participating firms were ranked on the basis of pre-tax return on assets. The high-profit category includes the top 25 percent of the firms based on return on assets. The figures reported for the high-profit firms represent a median for this group.
However, this does not tell the entire story. A high-profit company has more money available to invest in additional assets. If the additional assets are chosen properly, they will support higher sales. With higher sales, the firm then can produce even higher profits. It is a cycle that allows high-profit companies to move well ahead of typical ones. Over time, typical firms will reach the point where they simply can't catch up.
Reaching high-profit performance is a matter of identifying what is important and developing a plan to improve regarding those factors. The items that are most important are called critical profit variables. Critical profit variables are outlined in Figure 4 with specific information about the results produced by typical and high-profit firms. Note that Figure 4 is simply an example showing how two companies with the same sales base can have different profits because of their critical profit variables.
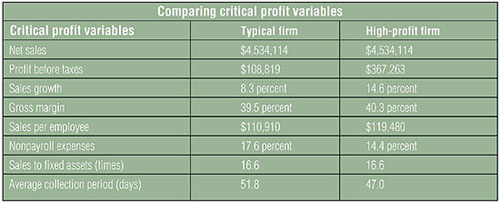
Figure 4: How a typical roofing firm compares with a high-profile firm
It also is important to note no single business produces superior results on every critical profit variable. Successful firms combine critical profit variables in a way that maximizes overall profitability. When reviewing the critical profit variables in Figure 4, remember a high-profit company is far from perfect. Typical firms may outperform high-profit firms on individual factors. What a high-profit firm does is put together a set of critical profit variables that results in greater profitability. It is a pattern every firm should use as a role model. What follows is a more detailed explanation of the critical performance variables listed in Figure 4.
Critical performance
Although rapid sales growth is not a requirement for driving higher profits, rapid sales growth is essential to generate at least moderate growth. Moderate is, of course, a subjective term. At a minimum, a firm should be able to increase its sales at least as fast as operating expenses increase. Ideally, it should target sales increases somewhere between 1 percent and 2 percent faster than operating expenses.
The ability to generate an adequate gross margin continues to be a major determinant of profitability. Although a high-profit firm does not necessarily have a higher gross margin every year, it consistently has a higher gross margin over the long term. The pressures on gross margin from suppliers and customers are not going to diminish. However, financial success necessitates producing small systematic improvements in the gross margin percentage every year. Figure 5 identifies the survey respondents' average sales and gross margin per employee broken into five sales volume categories.
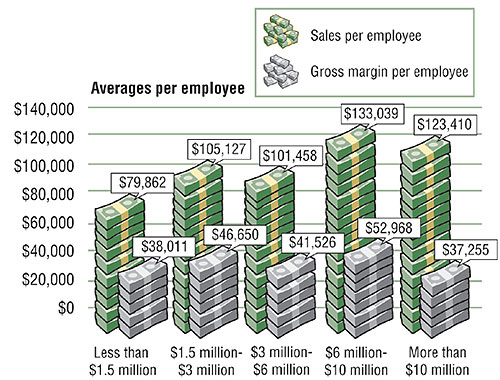
Figure 5: Average sales and gross margins per employee based on company sales volume
Payroll is by far the most important expense factor, which means controlling payroll is essential to controlling expenses. In recent years, payroll has replaced gross margin as the single most important driver of profitability because payroll expenses, especially fringe benefits, have increased relentlessly.
One of the best ratios available to evaluate payroll is the sales-per-employee ratio. This is computed by simply dividing net sales by the total number of full-time (or equivalent) employees. Strategically, it measures how effectively a firm uses its employee base. One major challenge faced by firms is the expansion of services provided to customers. Unfortunately, this increase in service, which also increases payroll costs, has not necessarily resulted in higher sales volumes.
Of all the critical profit variables, the ratio of sales per employee probably is the most difficult to bring into line because most of the services that must be provided to customers increase directly with additional sales activity, requiring additional employees. Additional roofing projects require additional estimation, additional billing, etc. The key for roofing contractors is to find ways to change the traditional mode of operation so additional sales do not require additional employees.
When analyzing nonpayroll expenses, companies typically measure them as a percent of sales. In most instances, nonpayroll expenses need only minor adjustments. Unfortunately, there are numerous areas within a firm that need to be examined. Controlling nonpayroll expenses probably always will involve examining every expense category with the hope of making modest improvements in a number of areas.
Because the roofing industry requires a large investment in fixed assets, we can imagine that managing these investments has been a major area of concern for the past several years. However, because the investments are defined as "fixed," there is some hesitancy to view them as controllable. In reality, the ability to drive higher levels of sales from a given fixed asset base often is one of the keys to success.
The average collection period (sometimes called "days sales outstanding") has more of an effect on cash flow than on profitability. It also usually proves to be a difficult ratio to improve. For most firms, a realistic goal is to maintain performance at existing levels. Figure 6 identifies the average collection period for years 1998, 2000, 2002 and 2004 of the survey.
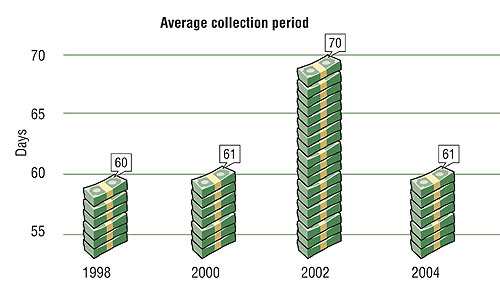
Figure 6: Average collection period in years the survey was conducted
In looking at the big picture, financial performance varied widely among NRCA contractors in 2004. The typical firm had sales of $4,534,114 and a pre-tax profit of 2.4 percent. And as noted earlier, high-profit firms had pre-tax profits of 8.1 percent with sales of $4,693,557. What has an even more resounding effect is the typical firm had a pre-tax return on assets of only 7.4 percent, whereas the high profit firm pre-tax return on assets was 28.3 percent. A number of factors can account for the vast difference in the results, but most of the differences are best reflected in the critical profit variables.
Editor's note: To purchase the complete survey results, contact NRCA InfoExpress at (866) ASK-NRCA (275-6722) or access shop.nrca.net.
Albert D. Bates is chairman and chief operating officer of Profit Planning Group, a research and executive education firm in Boulder, Colo. Olicia V. Hinojosa is NRCA's manager of contractor management programs.
The survey's nine regions
Northeast
Connecticut, Maine, Massachusetts, New Hampshire, New Jersey, New York, Rhode Island and Vermont
Mid-Atlantic
Delaware; Maryland; Pennsylvania; Virginia; Washington, D.C.; and West Virginia
Southeast
Florida, Georgia, North Carolina and South Carolina
North Central
Illinois, Indiana, Michigan, Minnesota, Missouri, Ohio and Wisconsin
Plains
Iowa, Kansas, Nebraska, North Dakota and South Dakota
South
Alabama, Arkansas, Kentucky, Louisiana, Mississippi and Tennessee
Mountain
Colorado, Idaho, Montana, Nevada, Utah and Wyoming
Southwest
Arizona, New Mexico, Oklahoma and Texas
Pacific
Alaska, California, Hawaii, Oregon and Washington