Editor's note: The opinions in this article are those of the authors and not NRCA.
Does it make sense to wear shorts, a T-shirt and sandals while boarding a plane in Hawaii bound for Chicago in January? Most of us have seen these types of travelers whose decision processes probably were bypassed by the excitement of their journeys.
This type of excitement also can overcome designers who often are more excited about the concept of building design than building function or performance. In theory, there is potential for a building in Chicago to be clad with shorts and a T-shirt in January instead of being clad with a wool sweater. This may not sound realistic, but using the Federal Trade Commission's (FTC's) energy model calculations to determine effective R-values for insulation material (as many designers do) also is not realistic and can potentially lead to increased energy costs, poor indoor performance, and mechanical equipment being oversized or undersized.
Background
Climate-driven R-value (CDRV) is a process to predict an effective R-value for any given insulation material based on local climatic hourly temperatures. It uses an approach of estimating a roof assembly's monthly kilowatt-hour energy consumption based on transient local temperatures rather than the 75 F mean temperature mandated in the FTC's 16 CFR Part 460.5, "Labeling and Advertising of Home Insulation: Trade Regulation Rule."
FTC rule 460.5 stipulates: "The tests must be done at a mean temperature of 75 [degrees] Fahrenheit and with a temperature differential of 50 [degrees] Fahrenheit plus or minus 10 degrees Fahrenheit. The tests must be done on the insulation material alone (excluding any airspace). R-values ("thermal resistance") based upon heat flux measurements according to ASTM C177-04 or ASTM C518-04 must be reported only in accordance with the requirements and restrictions of ASTM C1045-01, 'Standard Practice for Calculating Thermal Transmission Properties from Steady-State Conditions.'"
Although this FTC ruling only applies to residential buildings, it has become de facto industry practice and insulation manufacturers have been focused on satisfying this FTC rule for all types of buildings.
Other standard energy model calculations, such as described in ASHRAE's standard 90.1-2010, "Energy Standard for Buildings Except Low-Rise Residential Buildings," also use one specific manufactured, self-identified R-value for all climate zones. However, such calculations do not take into account changes in temperatures that would closer mimic in-situ performance.
ASTM International roofing standards, such as ASTM C1289-13, "Standard Specification for Faced Rigid Cellular Polyisocyanurate Thermal Insulation Board," include options for R-values of insulation at various temperatures. ASTM C518-10, "Standard Test Method for Steady-State Thermal Transmission Properties by Means of the Heat Flow Meter Apparatus," also includes four data points for testing thermal transmission at 25 F, 40 F, 75 F and 110 F, indicating other testing options are available for foam plastic or fibrous insulations.
There are several reasons why an insulation material's thermal performance is affected by temperature, including convection, conduction and radiation. Typically, insulation materials increase in R-value at lower temperatures and decrease in R-value at higher temperatures.
There are some types of foam plastic insulation incorporating a blowing agent that results in cell structure condensation at lower temperatures. This cell structure condensation increases thermal conductivity and can drastically reduce R-value performance.
Figure 1: Excerpt from Honeywell International Inc.'s abstract, "Meeting the Insulation Requirements of the Building Envelope with Polyurethane and Polyisocyanurate Foam"
Many publications address the way temperature affects roof insulation R-values of polyurethane, polyisocyanurate and mineral wool. For example, in a 2005 abstract published by Honeywell International Inc., Morristown, N.J., "Meeting the Insulation Requirements of the Building Envelope with Polyurethane and Polyisocyanurate Foam," it states: "Although many factors influence the performance of insulation, the blowing agent has perhaps the most significant effect. This is because closed-cell polyurethane and polyisocyanurate insulation is composed of 97% gas by volume. Therefore, the gas in cells becomes a key factor in how insulation performs over a wide range of mean temperatures. Insulating gases transition between a condensed liquid and gaseous state depending on what temperatures they are exposed to. In order for a gas to function as an insulating gas in the cell of polyurethane and polyisocyanurate foam it must be in a gaseous state" (see Figure 1).
CDRV research
RDH Building Engineering, Vancouver, Canada, is conducting a long-term study into the many effects of thermal resistance to roof systems. Using testing guidelines in ASTM C1289-13 and ASTM C726-12, "Standard Specification for Mineral Wool Roof Insulation Board," the study is conducting three insulation strategies with similar R-values—an assembly of polyisocyanurate, an assembly of stone wool, and a hybrid assembly that includes polyisocyanurate and stone wool insulations.
In a research paper presented at RCI Inc.'s 2014 International Convention and Trade Show, RDH Building Engineering identified how insulation's thermal resistance changed in different temperatures. The paper explained as roof temperature changed throughout the day, the thermal resistance of the polyisocyanurate insulation varied greatly as compared with the stone wool and hybrid insulation. Because of stone wool insulation's properties, the thermal resistance did not vary as drastically, and the insulation's efficiency was much closer to the expected (or specified) performance. The hybrid insulation was able to remain closer to the expected performance because the stone wool layer insulated the polyisocyanurate layer, keeping it closer to the optimal-performance temperature of polyisocyanurate.
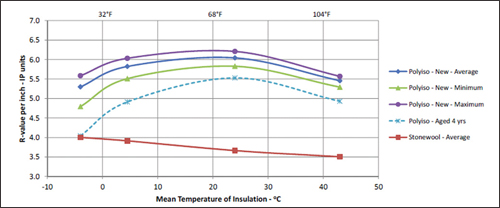
Figure 2: Apparent R-value per inch for stone wool and polyisocyanurate roof insulation
Figure 2 shows the varying performance of the polyisocyanurate samples used in the research study, with the polyisocyanurate samples achieving optimal performance closer to the 75 F mean temperature reported. These findings are in line with research conducted by Building Science Corp. (BSC), Westford, Mass., as published in BSC Information Sheet 502, "Understanding the Temperature Dependence of R-values for Polyisocyanurate Roof Insulation," and research conducted by NRCA regarding the effects of temperature on polyisocyanurate insulation.
RDH Building Engineering's research shows insulation's thermal resistance changes across temperatures, but building designs continue to use the reported 75 F mean temperature R-values. Accordingly, when designing buildings, designers should begin moving toward using different temperatures when specifying insulation according to buildings' locations.
Warm climates
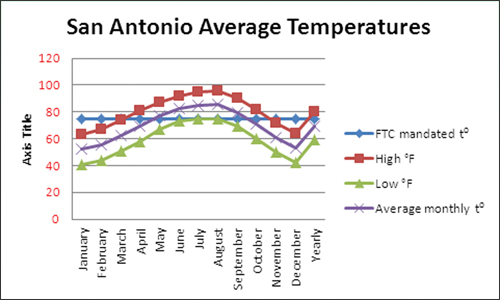
Figure 3: Average San Antonio temperatures according to www.currentresults.com
Located in ASHRAE's climate zone 2, San Antonio is considered a warm city. However, according to www.currentresults.com, a weather and science facts website, San Antonio's temperatures often don't meet or surpass the 75 F mean temperature (see Figure 3). The yearly average for San Antonio is 59 F and well below the FTC's 75 F mean temperature requirement. As previously stated, the thermal performance of some insulation material types are reduced at lower temperatures and some are increased, even at 59 F. Therefore, using the FTC rule in a warm climate such as San Antonio is irrelevant, and its irrelevancy increases drastically in colder climates.
Cold climates
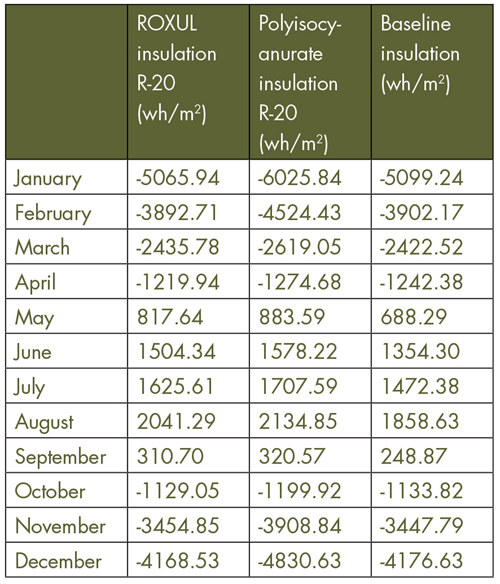
Figure 4: An energy model comparison calculation demonstrating the energy loss/gain for three R-20 roof assemblies located in Chicago
To illustrate the difference between the FTC's R-value rule and the predicted energy performance using climate-derived R-values, we can turn our attention back to Chicago. Figures 4 and 5 show an energy model comparison calculation demonstrating the energy loss/gain for three R-20 roof assemblies located in Chicago. These three comparisons show the CDRV-predicted performance for mineral wool, polyisocyanurate and a static R-value insulation without changes in R-values as a result of temperature. Note the monthly variance in watt-hour per square meter (wh/m2) gains/losses compared with the baseline. In colder climate months, the disparity is greater than warmer months. From May to September, a building requires cooling; the rest of the year it requires heating. This leads one to assume that in colder climates the underestimated energy calculations are greater than in warmer climates.
Figure 5: A graph of data from Figure 4 showing an energy model comparison calculation demonstrating the energy loss/gain for three R-20 roof assemblies located in Chicago
Temperatures to use
Figure 6 depicts yearly average temperatures of major U.S. urban centers. Note only Los Angeles' annual average high temperature reaches the FTC mandated R-value, and its yearly average only is 65.5 F. The point here is choosing the FTC R-value is not prudent; a building owner will incur extra energy costs, not to mention the added carbon dioxide in the atmosphere.
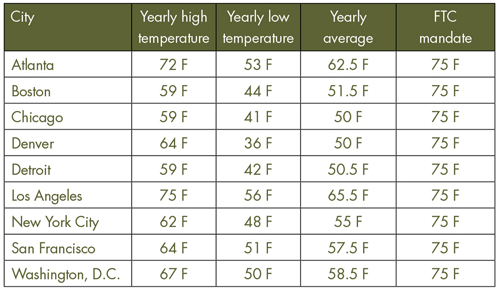
Figure 6: Average temperatures for large U.S cities according to www.currentresults.com
Yearly average temperatures are available for many local regions across North America and can be used to help understand the temperature ranges expected for a location to make a more informed decision about the amount and type of insulation to be used in a roof assembly.
Design better
We now know temperature affects insulation's thermal resistance, so the question is how should we adequately design roof assemblies to ensure energy consumption projections are closer to real-life consumption?
One option: Instead of using the de facto 75 F when running energy modeling for a nonresidential application, manually enter local yearly lows if the heating-degree days (HDDs) are greater than cooling-degree days (CDDs) and vice versa if the CDDs are greater than the HDDs.
Another strategy currently being used includes specifying insulation thickness instead of R-value per inch. Other industries, such as in the fenestration industry, use a U-value.
However, caution should be exercised when choosing insulation—the R-value per inch of the chosen insulation should closely reflect the four data points published in ASTM C518-10, and if some R-values are not published, we are certain many manufacturers would be pleased to supply the data.
Rockford Boyer, BSSO, is North American manager, energy design centre for ROXUL® Inc., Milton, Ontario, and Saverio Marzella, CDT, RRO, RCI, is U.S. national sales manager for ROXUL.