For years, the construction industry has been feeling the pinch of a diminishing labor supply. As roofing contractors attempt to recruit more help, they may encounter unanticipated expectations from a new generation of workers. These younger workers seek collaborative professional environments, strong wages and comprehensive health insurance plans.
The recently completed 2017 NRCA Wage and Benefits Survey of NRCA contractor members provides a set of benchmarks about average annual salaries and bonuses for employees by position. The survey also captures the range and types of benefits employees receive in the field and office, such as insurance and retirement plans, plus additional benefits such as educational assistance, employee assistance programs, vehicle use and cell phone availability.
As prospective employees seek employment opportunities that rival traditional career paths, the 2017 NRCA Wage and Benefits Survey provides insight into how to attract these workers.
The 2017 survey
Previously conducted in 2006, the survey has been a beneficial tool for roofing contractors across the U.S. Data contained within this most recent edition reflect a changed and improved economy in the aftermath of the Great Recession. According to iHire Construction, an online construction career center, the U.S. construction industry bottomed out in 2011, much later than the rest of the economy. And the decline continued into 2013, much longer than other sectors. More than 2.3 million jobs were lost, and currently only about half of those jobs have returned, according to iHire.
In the years since the recovery began, the economy has grown slowly, but roofing contracting firms are optimistic. According to Transparency Market Research, a market research consulting firm based in Albany, N.Y., the global roofing market is likely to exhibit a compound annual growth rate of 6.4 percent between 2017 and 2024. The market, valued at $71.2 billion in 2015, is expected to rise to $124.5 billion by 2024. And, according to international human resources consulting firm Mercer LLC, New York, the U.S. demand for residential and commercial roofing products is forecast to advance 4 percent per year, ultimately increasing opportunities to recruit and retain employees in the field and office while providing better wages.
For the 2017 survey, all U.S. NRCA contractor members were given the opportunity to participate; results shared in this article and the full survey report are based on 239 contractor responses, which represents a 10 percent response rate, typical for this type of survey.
Contractors from nine U.S. geographic regions responded to the survey. They represent companies with annual sales in six categories—the sixth category, $15 million or more, is new and reflects a general increase in the sizes of NRCA contractor member companies. The survey results were analyzed as a whole, as well as by region and size (based on annual sales).
Because of varying response rates in the region and size categories, the results are not intended to provide a perfect snapshot of wages and benefits information provided by roofing contractors. However, the results provide a point of reference for contractors so they can assess their own policies and practices relative to the whole and categories into which they fit.
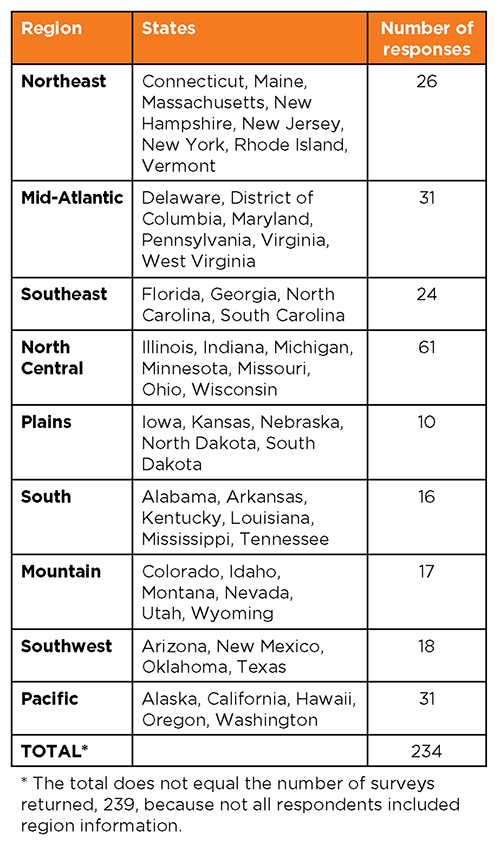
Figure 1: Data analyzed by region |
Data were analyzed by region (see Figure 1) and annual sales (see Figure 2).
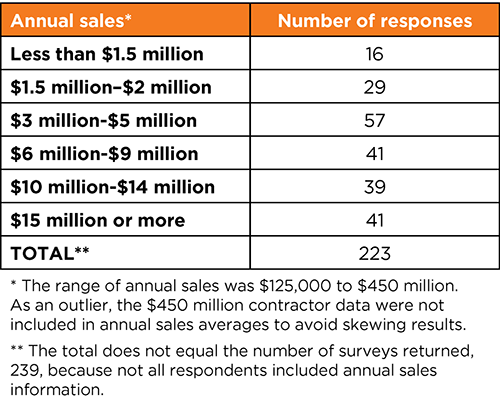
Figure 2: Data analyzed by average annual sales |
Data highlights
Commercial contracting activities exceed residential contracting activities among members surveyed, which is in line with current NRCA membership data, with respondents reporting 76 percent of their business comes from commercial roofing and 24 percent from residential roofing. Also consistent with NRCA membership data, 76 percent of responding contractors report operating open-shop companies, 16 percent operate union shops and 8 percent operate dual shops.
Overall reports of payroll as a percentage of annual sales can be seen in Figure 3. Average salaries and bonuses combined for the surveyed positions appear in Figure 4. Average wages for field workers/roof mechanics, sheet metal workers and other positions appear in Figure 5 and Figures 6 and 7.
The survey targeted traditional positions in roofing contractor organizations, but the data suggest that as roofing businesses become larger, they hire specialized employees. Contractors reported employing credit managers, account managers and fleet managers. Larger contractors have branch managers, telemarketers, logistics personnel and full-time IT staff. And other positions are moving in-house, including foam and tile installers, masons and crane operators. Roofing contractors not only employ roofing-focused professionals, they now also hire more relationship-driven management staff, such as specialized operations personnel and technology workers.
Benefits
Traditional benefits, such as health and other insurance, retirement plans and paid time off, continue to be offered to employees of roofing companies. Overall, 79 percent of the companies surveyed offer office employees some type of health insurance, which is comparable to previous surveys. About 62 percent of field employees receive insurance from their employers (with some contractors reporting unions provide this benefit). Most companies offering insurance pay at least 50 percent of premiums. Some companies are supplementing high deductibles with cash benefits to help employees meet the rising costs of health care, even with insurance.
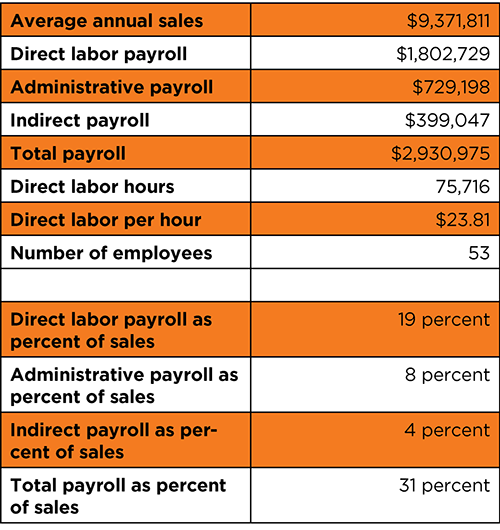
Figure 3: Average annual sales and payroll for all respondents |
Eighty percent of roofing contractors support some type of retirement plan with a majority offering a 401(k). Across all retirement options, including 401(k), profit sharing, simplified employee pension and stock option plans, the average contractor contribution is about 5 percent.
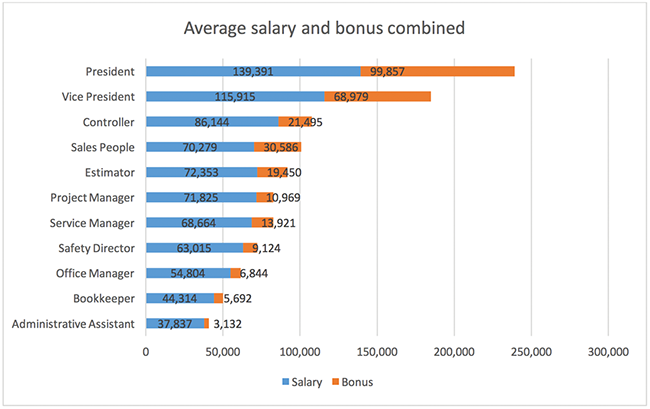
Figure 4: Average salaries with bonuses combined |
Paid time-off policies reflect common practices: one-week vacation for field employees and those with the least tenure, increasing to two and three weeks for longer tenure and office employees. About seven paid holidays were offered across the board. However, sick pay policies are shifting.
Many contractors reported having paid time-off "banks" where employees may use a given number of paid days off without having to declare a reason. This practice somewhat inflated the vacation pay for office employees as contractors reported the total days in this category and referenced the paid time off as sick days. Although paid time-off banks have been used for decades, they are becoming increasingly popular with employers because they eliminate the need to police why an employee needs or wants to use time off.
Several contractors reported having no limits for any paid days off, leaving it to the employee to determine how many days he or she needs. Less common than paid time-off banks, these no-limits benefits generally are reserved for top-level employees. In both cases, employees who are "plugged in" to work via technology enjoy a degree of independence from the office that allows them to better balance professional and personal demands.
Wage increases
Although benefits remain an important part of an overall employment package, workers are demanding better pay. In fact, 60 percent of respondents to the 2016 Job Satisfaction and Engagement Survey from the Society for Human Resource Management (SHRM) named compensation/pay as the No. 1 contributor to overall job satisfaction. By comparison, benefits ranked fourth. In 2010, compensation ranked fifth. SHRM's findings show why small-business owners need to stay current with the going pay rates in their regions. Depending on location, the rates vary substantially, according to data from the Bureau of Labor Statistics (BLS), one of the most comprehensive sources for wage and benefits data.
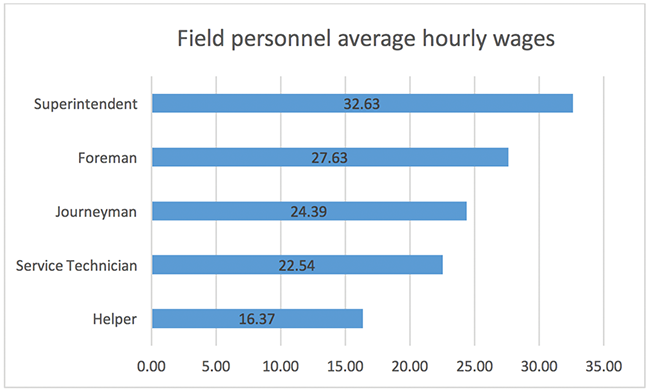
Figure 5: Average wages for field personnel |
According to this year's survey, there is great variability in the rate of increase in nominal pay (unadjusted for inflation) among positions since the 2006 wage and benefits survey. For salaried personnel, the controller position experienced a 54 percent increase, the greatest increase in salary and bonus combined; president's pay increased 31 percent. The estimator position salary and bonus combined rose 22 percent during the past 11 years, and project managers came in with an average 7 percent increase. According to BLS, nominal pay for U.S. jobs in general increased 28 percent for the same period.
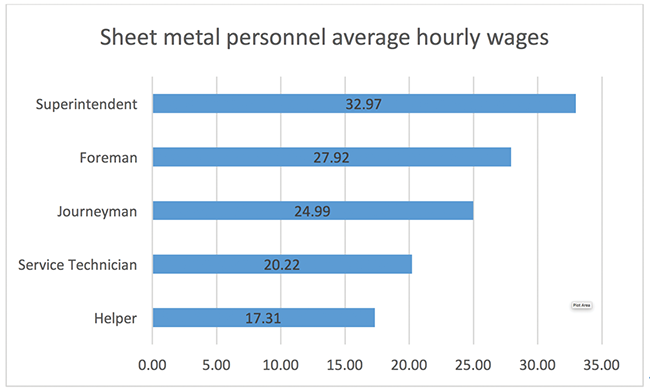
Figure 6: Average wages for sheet metal workers |
For field personnel, all but one position showed a double-digit increase. Helpers saw the greatest gains, followed by superintendents. Service technicians and drivers received the lowest pay increases.
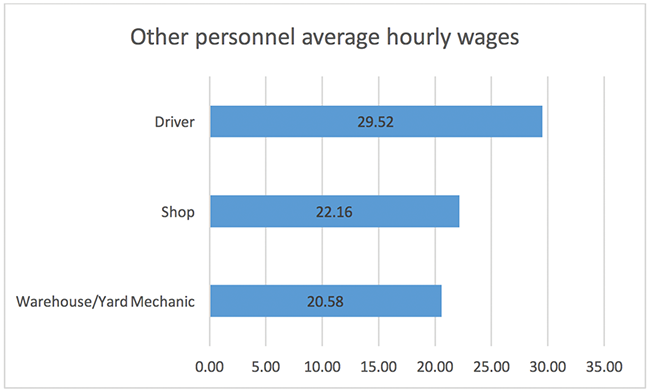
Figure 7: Average wages for other positions |
Balancing the workforce
In 2015, the U.S. labor market represented a milestone. For the first time, millennials (individuals born between 1980 and 2000) surpassed the Baby Boom generation as the nation's largest living generation. According to BLS, millennials make up 34 percent of the nation's workforce—a number that's expected to grow to 50 percent by 2020. Generation Z (the generation after millennials) entered the workforce in 2016 and is expected to account for 20 percent of the workforce by 2020.
These numbers represent a significant shift for companies that now have to figure out how to most effectively attract, retain and develop these younger workers—not all of whom are following their parents' examples when it comes to job selection, company loyalty and career pathing. Given the drastic ebbs and flows the construction industry has suffered for decades, it faces an even bigger challenge when it comes to attracting and retaining new workers.
And though good wages remain the top job consideration for the digital generation, it is not all-encompassing.
The priorities are changing from "just money" to "finding interesting and challenging work with genuine career opportunities" in a relatable culture for the employee. The growing multigenerational workforce wants a collaborative environment with strong, open communication where there is regular feedback and recognition as well as attractive wage and benefit packages—it's a real balancing act.
The full report
The results of the wage and benefit survey represent an opportunity for roofing contractors to bring new hires into the industry. Often, average wages for entry-level positions surpass the minimum wage by 50 percent. Although some employers are reducing their benefits offerings, many roofing contractors provide generous "safety net" benefits on top of professional development support. Wages are important, but younger workers are savvy about the cost of insurance and the need to build their professional skills. By making the generous wages and benefits in the roofing industry more transparent, roofing contractors may tap into a larger pool of employees eager to join their ranks.
NRCA members who participated in the survey will receive a complimentary copy of the full report in October.
The survey also is available through NRCA's bookstore, shop.nrca.net.
Karen L. Cates, PH.D., is a leadership consultant and adjunct professor of executive education at the Kellogg School of Management at Northwestern University, Evanston, Ill. Alison L. LaValley, CAE, is NRCA's vice president of strategic partnerships and development and executive director of the National Roofing Legal Resource Center.
Safety grows with the company
Contractors continue to strive for a safety culture in the shop and office and on the job site.
Safety directors develop and oversee general health and safety policies and ensure workplaces and workforces comply with Occupational Safety and Health Administration and other government and industry regulations. One-third of survey respondents indicate they employ a dedicated safety director. A full-time safety director position was not reported by any responding contractors until annual sales reached $3 million or more per year. Anecdotally, we learned until a company reaches that threshold, safety director responsibilities are shared by the owner, superintendent and other workers who manage safety through training and by seeing and addressing issues as they arise. Growing incentives continue to push safety to the fore even in smaller companies, especially given worker shortages, legal pressure and insurance costs.